
The Ultimate Guide to Digital Forensics: Unlocking Digital Evidence
By 0x6a03448f4d
Published on May 12, 2025
Digital forensics is the art and science of uncovering hidden truths in the digital world. Whether it’s tracking a cybercriminal’s footsteps or investigating an insider threat, forensic analysts play a critical role in cybersecurity. As a budding SOC analyst, I’ve compiled my detailed notes into this comprehensive guide to help you navigate the fascinating field of digital forensics. From analyzing Windows file systems to dissecting malware, this article covers it all. Let’s dive in!
What is Digital Forensics?
Digital forensics involves identifying, preserving, analyzing, and presenting digital evidence in a way that’s admissible in court or useful for security investigations. It’s a reactive tool for incident response and a proactive one for uncovering vulnerabilities. For Security Operations Center (SOC) analysts, it’s a superpower that reveals what happened during a breach.
The Five Stages of Digital Forensics
Every forensic investigation follows a structured process:
Identification -> Pinpoint potential evidence sources (e.g., disks, memory, logs).
Collection -> Gather data using forensically sound methods to avoid tampering.
Examination -> Dive into the data to extract relevant information.
Analysis -> Interpret findings to reconstruct events or identify threats.
Presentation -> Summarize results in clear, court-admissible reports.
Key Steps in an Investigation
Here’s a practical checklist for a forensic investigation:
- Create a forensic image (a bit-for-bit disk copy).
- Document the system’s state (e.g., running processes, open files).
- Preserve evidence to maintain its integrity.
- Analyze data for clues like timestamps or malicious files.
- Perform timeline analysis to reconstruct events.
- Identify Indicators of Compromise (IOCs), such as malware signatures.
- Report findings in a clear, concise manner.
NTFS Forensics: Decoding the Windows File System
The New Technology File System (NTFS) is Windows’ default file system and a treasure trove for forensic analysts. Here’s what you need to know:
Key NTFS Artifacts
NTFS stores a wealth of data that can reveal user and attacker activity. The most critical artifacts include:
- File Metadata: Timestamps and permissions that show when and how files were used.
- Master File Table (MFT): The core of NTFS, storing metadata for all files and directories.
- File Slack & Unallocated Space: Remnants of deleted files that may still be recoverable.
- USN Journal: Logs file operations (create, delete, rename).
- LNK Files: Shortcuts that reveal accessed files and their locations.
- Prefetch Files: Track executed programs and their run times.
- Registry Hives: Store system and user configurations.
- Shellbags: Record folder access history.
- Recycle Bin: Holds deleted files temporarily.
- Alternate Data Streams (ADS): Hidden data attached to files.
- Volume Shadow Copies: Snapshots for recovery and auditing.
The Master File Table (MFT)
Located at C:\$MFT, the MFT is NTFS’s backbone, storing metadata like file names, timestamps, and locations. Each MFT record (typically 1024 bytes) includes:
- Header: Record ID and flags.
- STANDARD_INFORMATION: Timestamps and permissions.
- FILE_NAME: File name and namespace.
- DATA: File content (resident for small files, non-resident for larger ones).
The MFT is critical for recovering deleted files and detecting timestomping, where attackers alter timestamps to hide activity. Since MFT records are reused rather than deleted, they’re a forensic goldmine.
MAC(b) Timestamps
NTFS tracks four timestamps, known as MAC(b):
- Modified (M): When file content was last changed.
- Accessed (A): When the file was last opened or read.
- Changed ©: When the MFT entry was last updated (e.g., moved or renamed).
- Birth (b): When the file was created.
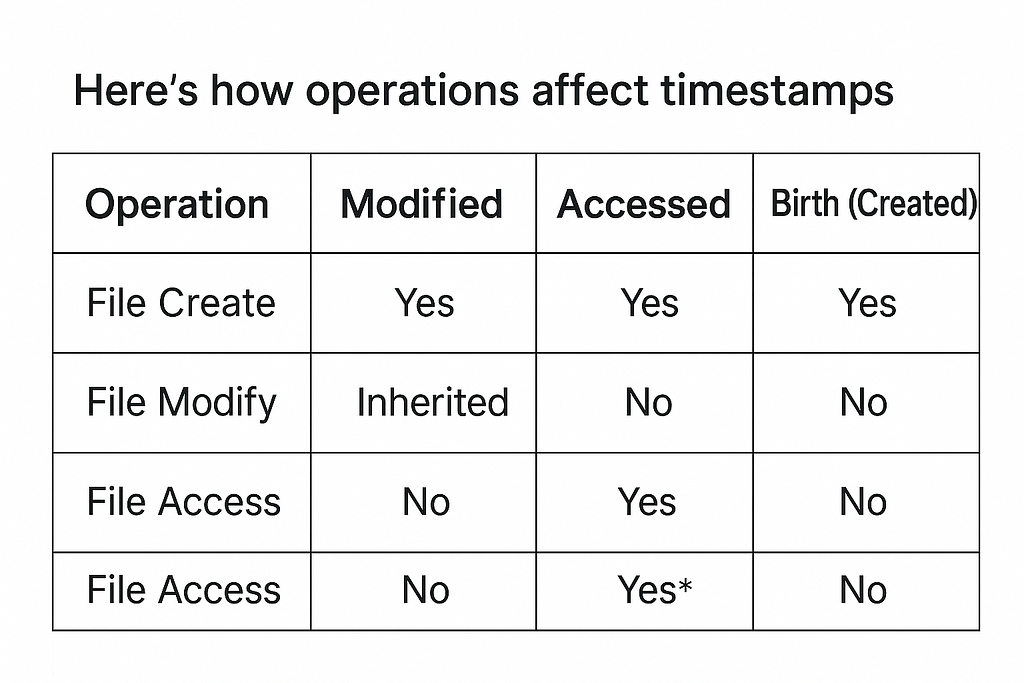
*Accessed updates may be disabled for performance.
Timestamps are stored in the MFT’s $STANDARD_INFORMATION and $FILE_NAME attributes, making them essential for reconstructing activity timelines. Watch out for timestomping (T1070.006), where tools like Cobalt Strike fake timestamps to evade detection.
USN Journal
The Update Sequence Number (USN) Journal, located at \$Extend\$J, logs file system changes. It’s invaluable for tracking file creations, deletions, or renames. Parse it with MFTECmd:
MFTECmd.exe -f "$Extend\$J" --csv output --csvf usn_journal.csv
This generates a CSV for tools like Timeline Explorer, showing file names, timestamps, and operations.
Zone.Identifier and Mark of the Web (MotW)
The Zone.Identifier is an NTFS metadata attribute that flags files from untrusted sources (e.g., ZoneId=3 for internet downloads). The Mark of the Web (MotW) triggers security warnings, like Protected View in Microsoft Word. Check Zone.Identifier with PowerShell:
Get-Item * -Stream Zone.Identifier -ErrorAction SilentlyContinue
Get-Content * -Stream Zone.Identifier -ErrorAction SilentlyContinue
Default Log Storage
Windows event logs, critical for forensics, are stored at:
C:\Windows\System32\winevt\logs
Windows Execution Artifacts: Tracking Program Activity
When programs run on Windows, they leave traces that forensic analysts can analyze. Here are the key artifacts:
Common Execution Artifacts
- Prefetch Files: Log executed programs, run counts, and timestamps.
- Shimcache: Tracks executed files and their paths.
- Amcache: Records installed apps and execution metadata.
- UserAssist: Registry keys tracking user-executed programs.
- RunMRU Lists: Log commands entered in the Run dialog.
- Jump Lists: Track recent files per application.
- Shortcut (LNK) Files: Metadata on accessed files.
- Recent Items: List recently opened documents.
- Windows Event Logs: Log process creation and system events.
- BAM (Background Activity Moderator): Tracks background tasks.
Artifact Locations
- Artifact Location/Registry Key Prefetch Files C:\Windows\Prefetch-
- Shimcache HKEY_LOCAL_MACHINE\SYSTEM\CurrentControlSet\Control\Session Manager\AppCompatCache
- Amcache C:\Windows\AppCompat\Programs\Amcache.hve
- UserAssist HKEY_CURRENT_USER\Software\Microsoft\Windows\CurrentVersion\Explorer\UserAssist
- RunMRU Lists HKEY_CURRENT_USER\Software\Microsoft\Windows\CurrentVersion\Explorer\RunMRU
- Jump Lists %AppData%\Microsoft\Windows\Recent
- Shortcut (LNK) Files Desktop, Start Menu, etc.
- Windows Event Logs C:\Windows\System32\winevt\Logs
Prefetch Files
Stored in C:\Windows\Prefetch as .pf files (e.g., NOTEPAD.EXE-123ABC.pf), Prefetch files speed up program loading and log execution details. Analyze them with PECmd:
PECmd.exe -d C:\Windows\Prefetch --csv output
Unusual execution paths may indicate malware.
Shimcache (AppCompatCache)
Located in the registry, Shimcache logs executed files, paths, and timestamps. Load the SYSTEM hive in Registry Explorer to analyze it, focusing on suspicious entries.
Amcache
The Amcache.hve file at C:\Windows\AppCompat\Programs stores execution paths, hashes, and install times. Parse it with AmcacheParser:
AmcacheParser.exe -f "C:\Windows\AppCompat\Programs\Amcache.hve" --csv output
BAM (Background Activity Moderator)
BAM tracks background tasks in the registry at HKEY_LOCAL_MACHINE\SYSTEM\ControlSet001\Services\bam\State\UserSettings\{USER-SID}. Use Registry Explorer or RegRipper’s bam plugin to analyze timestamps and executables.
Web Browser Forensics
Browsers leave a trail of user activity. Key artifacts include:
- Browsing History: URLs and visit timestamps.
- Cookies: Session data and authentication tokens.
- Cache: Stored web content, even after history deletion.
- Download History: Files downloaded and their sources.
- Passwords: Stored credentials (if saved).
- Bookmarks: Saved links for quick access.
- Extensions: Potential data leakage points.
These artifacts help reconstruct user actions, like visiting malicious sites or downloading suspicious files.
SRUM Forensics
The System Resource Usage Monitor (SRUM) tracks app usage, CPU, memory, and network activity. Key uses include:
- Application Profiling: Logs app paths and run times.
- Timeline Reconstruction: Builds activity timelines.
- Malware Detection: Spots unauthorized apps.
SRUM data is stored in SRUDB.dat and can be analyzed for incident response.
Evidence Acquisition: Tools and Techniques
Collecting evidence without altering it is critical. Here’s how to do it:
Forensic Imaging
Create exact disk copies with tools like:
- FTK Imager: GUI-based imaging and evidence preview.
- AFF4 Imager: Open-source tool with metadata support.
- DD/DCFLDD: Command-line disk duplicators.
Memory Acquisition
Capture volatile RAM data with:
- WinPmem: Open-source Windows memory capture.
- DumpIt: Easy RAM capture for Windows/Linux.
- Belkasoft RAM Capturer: Bypasses anti-debugging.
- Magnet RAM Capture: Free and effective.
RAM holds critical data like running processes, network connections, and encryption keys.
Network Evidence
Capture network activity with:
- Wireshark: GUI-based packet analysis.
- tcpdump: Command-line packet capture.
- Snort/Suricata: Intrusion detection systems.
- NetFlow/sFlow: Traffic flow analysis.
Why Mount a Disk?
Mount forensic images in read-only mode with Arsenal Image Mounter to analyze them safely without modifying content.
Volatile vs. Non-Volatile Evidence
- Volatile: RAM data lost on shutdown (e.g., running processes).
- Non-Volatile: Disk data that persists (e.g., logs, registry).
Non-volatile examples include Prefetch, Amcache, and event logs.
Memory Forensics: Peering into RAM
Memory forensics analyzes RAM to capture a system’s live state. The leading tool is Volatility, a Python-based framework with plugins like:
- pslist: Lists running processes.
- netscan: Scans network connections.
- malfind: Detects injected code.
- hivelist: Lists registry hives in memory.
Example: Identify a memory dump’s profile:
vol.py -f memory.dump windows.info
EPROCESS and DKOM
Each process has an EPROCESS structure in kernel memory, linked via FLINK (forward) and BLINK (backward) pointers. Rootkits use Direct Kernel Object Manipulation (DKOM) to hide processes by unlinking these pointers. Detect hidden processes with Volatility’s psscan:
vol.py -f rootkit.vmem psscan
Strings Analysis
Extract readable data (e.g., IPs, emails) from memory dumps with Strings or Linux’s strings command:
strings memory.vmem | grep -E "\b([0-9]{1,3}\.){3}[0-9]{1,3}\b" # Find IPsSANS Six-Step Methodology
Follow these steps for memory forensics:
- List processes and flag anomalies.
- Analyze DLLs and handles for injection.
- Inspect network connections.
- Detect code injection or hollowing.
- Scan for rootkits.
- Dump suspicious artifacts for analysis.
Disk Forensics with Autopsy
Autopsy is a powerful tool for analyzing disks and recovering evidence. Key features include:
- Deleted File Recovery: Scour pagefile.sys or unallocated space.
- Web Artifacts: Extract browser history, downloads, and cache.
- Timeline Analysis: Reconstruct events by file and app activity.
- Keyword Searches: Find specific terms or IoCs.
Autopsy Workflow
- Create a case (e.g., C:\Cases\Incident1).
- Add a data source (e.g., .E01 image).
- Search for suspicious files (e.g., malware.dll).
- Check .Zone.Identifier for file origins.
- Analyze MFT for timestomping.
- Generate CSV/HTML reports.
Tip: Work on forensic copies and document all actions for legal admissibility.
Windows Event Logs
Event logs (.evtx files) in C:\Windows\System32\winevt\Logs track system and user actions. Parse them with EvtxECmd:
EvtxECmd.exe -f system.evtx --csv output
EQL for Log Analysis
Use Endgame’s Event Query Language (EQL) to detect suspicious activity:
eql query -f sysmon.json "EventId=1 and (Image='*net.exe' and (wildcard(CommandLine, '* user*', '*localgroup *')))"
This detects commands like net users or net localgroup.
Registry Hives
Registry hives store system and user configurations in files like SYSTEM, SOFTWARE, and NTUSER.DAT. Key tools include:
- Registry Explorer: GUI for navigating hives and analyzing timestamps.
- RegRipper: CLI tool with plugins like compname or run:
rip.exe -r SYSTEM -p compname
Check Run keys for persistence mechanisms.
Analyzing API Call Data (.apmx64)
.apmx64 files from API Monitor log API calls like RegOpenKeyExA. Look for:
- Persistence: Calls to HKCU\...\Run or RegSetValueExA.
- Process Injection: Chains like OpenProcess → WriteProcessMemory → CreateRemoteThread.
PowerShell Transcripts
PowerShell transcripts in user document folders log commands and outputs. Watch for:
- Encoded or unusual commands.
- Privilege escalation attempts.
- Network calls (e.g., Invoke-WebRequest).
- Persistence via scheduled tasks.
Malware Investigation: A Case Study
Let’s walk through a malware investigation using your forensic toolkit:
Disk Triage:
- Open a case in Autopsy and search for payload.dll.
- Prioritize results by creation time and extract suspicious files (e.g., Finance08062023.iso).
Web Download Analysis:
- Check .Zone.Identifier for file origins (e.g., letsgohunt[.]site).
- Correlate with browser cache for download evidence.
ISO and Execution Chain:
- Mount the ISO and identify a malicious .dll and .lnk file using rundll32.exe.
Cobalt Strike Beacon:
- Analyze payload.dll with parse_beacon_config.py to extract C2 server details.
Persistence:
- Use Autoruns to check HKLM\...\Run for entries like photo443.exe.
- Verify file hashes with VirusTotal.
Timestomping:
- Compare $STANDARD_INFORMATION and $FILE_NAME timestamps in Autopsy to detect tampering.
SRUM Analysis:
- Parse SRUDB.dat to confirm data exfiltration (~430 MB).
Event Logs:
- Use Chainsaw with Sigma rules to detect Cobalt Strike, LSASS access, or UAC bypasses.
Prefetch and USN Journal:
- Analyze Prefetch with PECmd for execution timelines.
- Parse $UsnJrnl:$J with usn.py:
python usn.py -f $UsnJrnl:$J -o timeline.csv
Timeline Explorer:
- Load CSVs into Timeline Explorer to visualize events and filter by time or IoCs.
This workflow reconstructs the attack, from initial infection to persistence and exfiltration.
Conclusion: Your Forensics Journey Begins
Digital forensics is a blend of detective work and technical expertise. By mastering tools like Autopsy, Volatility, EvtxECmd, and RegRipper, you can uncover critical evidence and solve complex cases.
What’s next? Try analyzing a sample memory dump or disk image. The digital world is full of mysteries waiting to be solved. Happy investigating!
This guide is based on my personal notes, compiled to empower aspiring forensic analysts. Follow me on Medium for more cybersecurity insights!
Thanks for reading! If you have any tips? Share them in the comments!